
Learn Forex Chart Patterns|Chart Pattern Trading Strategy Step-by-Step Guide –Trading Strategy|Pennants|Flag|Rectangle
Trend following patterns:
1. Pennant
2. Flag
3. Rectangle
Pennants
As the market is pausing, you will find price retracting into a narrower and narrower configuration. The market squeezes itself from both the top and bottom. The Pennant show up just before the market takes off in its original direction.
Making this a Pennant, you will find that market leading into the formation creates a pole, a strong move that leads in to the pattern itself.


Flag
A Flag pattern is a take-a-break pattern as well. It starts off generally with a large quick move forming a fairly steep “pole”. Next comes the Flag formation as it gently moves up and down slightly against the initial move.
To be a true Flag, the formation takes place between two equally separated lines, a small support and resistance channel. The Bear Flag is formed as a slightly rising formation while a Bull Flag is a slightly falling formation.
After a large initial market move, there is a period of “covering”. That basically means traders who were in the initial large move are closing their positions. Some are closing their positions while others are opening new positions in the same direction as the initial move. This simultaneous buying and selling is like a tug-of-war between the bulls and the bears and the market doesn’t have the momentum to move in either way.
Once the open positions are covered, the remaining open positions and with the addition of the new positions will usually force price to take off in its initial direction


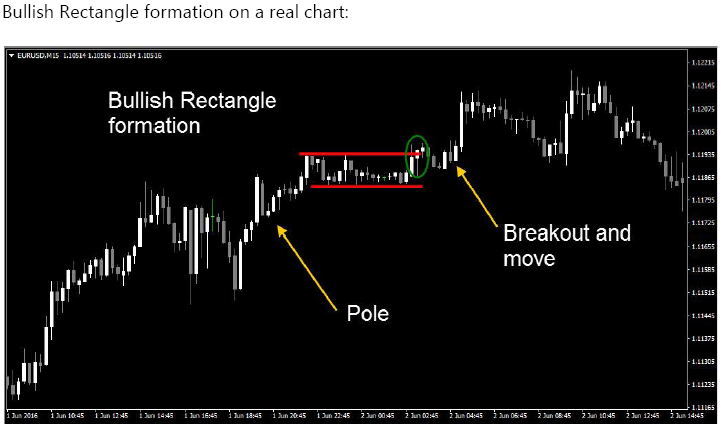
Rectangle
A rectangle is a fancy term for a range.
As price slows down after a bigger move, it will want to drift sideways for a bit. This drifting will have price floating up and down as regular business in the world influences price, but it’s pretty stable.
A rectangle is price action that you can sandwich between two horizontal lines, support and resistance levels. You will find this after a big move, but also after the major market participants go to sleep on a smaller timeframe. Rectangles are periods of equilibrium, and others say it’s a period of indecision. Either way it’s a pause in the market that has a clearly defined high and low.
A Rectangle can be very narrow as in a consolidated market, or a little wider where there is actual price movement inside of it. This is the classic formation for a “breakout” type of trade


Trend following patterns:
1. Pennant
2. Flag
3. Rectangle
Pennants
As the market is pausing, you will find price retracting into a narrower and narrower configuration. The market squeezes itself from both the top and bottom. The Pennant show up just before the market takes off in its original direction.
Making this a Pennant, you will find that market leading into the formation creates a pole, a strong move that leads in to the pattern itself.


Flag
A Flag pattern is a take-a-break pattern as well. It starts off generally with a large quick move forming a fairly steep “pole”. Next comes the Flag formation as it gently moves up and down slightly against the initial move.
To be a true Flag, the formation takes place between two equally separated lines, a small support and resistance channel. The Bear Flag is formed as a slightly rising formation while a Bull Flag is a slightly falling formation.
After a large initial market move, there is a period of “covering”. That basically means traders who were in the initial large move are closing their positions. Some are closing their positions while others are opening new positions in the same direction as the initial move. This simultaneous buying and selling is like a tug-of-war between the bulls and the bears and the market doesn’t have the momentum to move in either way.
Once the open positions are covered, the remaining open positions and with the addition of the new positions will usually force price to take off in its initial direction


Rectangle
A rectangle is a fancy term for a range.
As price slows down after a bigger move, it will want to drift sideways for a bit. This drifting will have price floating up and down as regular business in the world influences price, but it’s pretty stable.
A rectangle is price action that you can sandwich between two horizontal lines, support and resistance levels. You will find this after a big move, but also after the major market participants go to sleep on a smaller timeframe. Rectangles are periods of equilibrium, and others say it’s a period of indecision. Either way it’s a pause in the market that has a clearly defined high and low.
A Rectangle can be very narrow as in a consolidated market, or a little wider where there is actual price movement inside of it. This is the classic formation for a “breakout” type of trade


0 comments:
Post a Comment